UK Prosperity Map 2015
The Barclays UK Prosperity Map
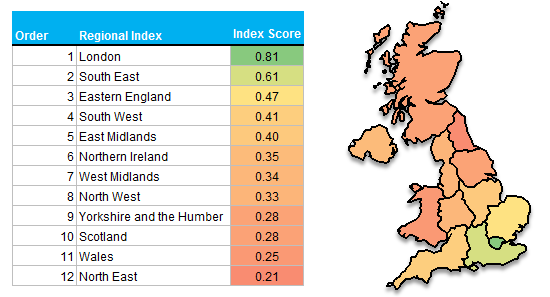
The Barclays UK Prosperity Map brings together eleven indicators of wealth and success to give a new snapshot of the UK and its different regions. A Prosperity Index score has been calculated by Opinium for each UK region:
The index reaffirmed London and the South East as the most prosperous regions, with higher than average household wealth, property prices and earnings.
However, even if a north-south divide may be apparent from the Map, the number of Northern start-ups is healthy, with hubs of activity such as the North East having a strong business growth rate second only to London.
The indicators included in the Prosperity Map were:
- t
- Median household wealth
- GDP per capita
- Unemployment rate
- Average weekly household expenditure
- Average house price
- Proportion of pupils with A*- C GCSE grades
- Mean number of paid hours per week
- Mean gross annual pay
- Business birth-to-death ratio
- Insolvency rate
- Households giving to charity
t
t
t
t
t
t
t
t
t
t


